Filtergram#
- class sdo.aia.Filtergram(inputs=0, outputs=0, axis_time='time', axis_wavelength='wavelength', axis_detector_x='detector_x', axis_detector_y='detector_y')[source]#
Bases:
FunctionArray[ExplicitTemporalSpectralWcsPositionalVectorArray,ScalarArray]A representation of an AIA image sequence using any number of filters.
Attributes
A
tupleofstrrepresenting the names of each dimension of this array.Return keys corresponding to all input axes representing bin centers
Return keys corresponding to all input axes representing bin vertices
The logical axis corresponding to changes in detector \(x\)-coordinate.
The logical axis corresponding to changes in detector \(y\)-coordinate.
The logical axis corresponding to changes in time.
The logical axis corresponding to changes in wavelength.
if this array has multiple components, broadcast them against each other.
Converts this array to an instance of
named_arrays.AbstractExplicitArray.Compute the index of each element of this array.
The inputs of the function.
L2-norm of this array.
Number of dimensions of the array.
The outputs of the function.
The number of elements along each axis of the array.
Total number of elements in the array.
The
named_arrays.AbstractArraytype corresponding to this array.The
named_arrays.AbstractExplicitArraytype corresponding to this array.Returns a new array with its units removed, if they exist.
Methods
__init__([inputs, outputs, axis_time, ...])add_axes(axes)Add new singleton axes to this array.
all([axis, where])Return
Trueif all of the elements along the given axes areTrue.any([axis, where])Return
Trueif any of the elements along the given axes areTrue.astype(dtype[, order, casting, subok, copy])Copy of the array cast to a specific data type.
broadcast_to(shape[, append])A new view of this array with the specified shape.
cell_centers([axis, random])Convert an array from cell vertices to cell centers.
combine_axes([axes, axis_new])Combine some of the axes of the array into a single new axis.
copy()Create a deep copy of this array.
Create a shallow copy of this array.
empty(shape_base, shape_wcs[, axis_time, ...])Create an empty
Filtergramsobject.from_fits(path, wavelength[, axis_time, ...])Given a single FITS file or an array of FITS files with the same OBSID, construct a SpectrographObservation object.
from_scalar_array(a[, like])Constructs a new version of this array using
aas the underlying data.from_time_range(time_start, time_stop, ...)Given a time range and a wavelength, download the corresponding AIA filtergram.
index(value[, axis])index_secant(value[, axis])interp_linear(item)Linearly interpolate this array to find its value at the given fractional index.
max([axis, initial, where])The maximum value of this array along the given axes.
mean([axis, where])The mean value of this array along the given axes.
median([axis])The median value of this array along the given axes.
min([axis, initial, where])The minimum value of this array along the given axes.
ndindex([axis_ignored])An iterator that yields the index of each element of this array.
pcolormesh(axs, input_component_x, ...[, ...])Plot a
FunctionArrayviamatplotlib.pyplot.pcolormesh().percentile(q[, axis, out, overwrite_input, ...])The requested percentile of this array along the given axes.
ptp([axis])The peak-to-peak value of this array along the given axes.
regrid(inputs[, axis, method, weights])Resample this function array onto a new set of input coordinates using
named_arrays.regridding.regrid().replace(**changes)A method version of
dataclasses.replace()for named arrays.reshape(shape)Reorganize this array into a new shape.
rms([axis, where])The root-mean-square of this array along the given axes.
std([axis, where])The standard deviation of this array along the given axes.
sum([axis, where])The sum of each element of this array along the given axes.
to(unit[, equivalencies, copy])Convert this array to a new unit.
to_string([prefix, multiline])Convert this array instance to a string representation.
to_string_array([format_value, format_unit, ...])Convert to an array of strings where each string has an appropriately-formatted unit attached to the value.
to_value(unit[, equivalencies])The numerical value of this array, possibly in a different unit.
transpose([axes])Reorder the axes of this array to the given sequence.
var([axis, where])The variance of this array along the given axes.
vmr([axis, where])The variance-to-mean ratio of this array along the given axes.
volume_cell(axis)Computes the n-dimensional volume of each cell formed by interpreting this array as a logically-rectangular grid of vertices.
weights(inputs[, axis, method])Compute the resampling weights of this array using
named_arrays.regridding.weights().Inheritance Diagram
- Parameters:
- classmethod empty(shape_base, shape_wcs, axis_time='time', axis_wavelength='wavelength', axis_detector_x='detector_x', axis_detector_y='detector_y')[source]#
Create an empty
Filtergramsobject.- Parameters:
shape_base (dict[str, int]) – The shape of the result excluding the axes handled by WCS.
shape_wcs (dict[str, int]) – The shape of the axes handled by WCS.
axis_time (str) – The logical axis corresponding to changes in time.
axis_wavelength (str) – The logical axis corresponding to changes in wavelength.
axis_detector_x (str) – The logical axis corresponding to changes in detector \(x\)-coordinate.
axis_detector_y (str) – The logical axis corresponding to changes in detector \(y\)-coordinate.
- Return type:
- classmethod from_fits(path, wavelength, axis_time='time', axis_wavelength='wavelength', axis_detector_x='detector_x', axis_detector_y='detector_y')[source]#
Given a single FITS file or an array of FITS files with the same OBSID, construct a SpectrographObservation object.
- Parameters:
path (Path | ScalarArray[Path]) – A single FITS file or an array of FITS files to load.
window – The spectral window to load.
axis_time (str) – The logical axis corresponding to changes in time.
axis_wavelength (str) – The logical axis corresponding to changes in wavelength.
axis_detector_x (str) – The logical axis corresponding to changes in detector \(x\)-coordinate.
axis_detector_y (str) – The logical axis corresponding to changes in detector \(y\)-coordinate.
wavelength (Quantity | ScalarArray)
- Return type:
- classmethod from_scalar_array(a, like=None)#
Constructs a new version of this array using
aas the underlying data.- Parameters:
a (float | Quantity | AbstractScalarArray) – Anything that can be coerced into an instance of
named_arrays.AbstractScalarArray.like (None | Self) – Optional reference object. If provided, the result will be defined by this object.
- Return type:
- classmethod from_time_range(time_start, time_stop, wavelength, user_email=None, series='aia.lev1_euv_12s', axis_time='time', axis_detector_x='detector_x', axis_detector_y='detector_y', limit=None)[source]#
Given a time range and a wavelength, download the corresponding AIA filtergram.
Important
Your email must be registered with JSOC to use this method.
- Parameters:
time_start (str | Time) – The start time of the search period
wavelength (Quantity | ScalarArray) – The wavelengths to download. Must be a valid AIA wavelength.
user_email (None | str) – An email address used to notify the user that their JSOC request is complete. This email must be registered with JSOC before using this function. If
None, the value is taken from theJSOC_EMAILenvironment variable.series (Literal['aia.lev1_euv_12s', 'aia.lev1_uv_24s']) – The data series to download. See the sunpy documentation for more information.
axis_time (str) – The logical axis corresponding to changes in time.
axis_detector_x (str) – The logical axis corresponding to changes in detector \(x\)-coordinate.
axis_detector_y (str) – The logical axis corresponding to changes in detector \(y\)-coordinate.
limit (None | int) – The maximum number of files to download for each wavelength.
- add_axes(axes)#
Add new singleton axes to this array.
- Parameters:
axes (str | Sequence[str]) – Either a single axis name or a sequence of axis names add to this array.
- Return type:
See also
named_arrays.add_axes()A functional version of this method.
- all(axis=None, where=<no value>)#
Return
Trueif all of the elements along the given axes areTrue.- Parameters:
- Return type:
See also
numpy.all()A functional version of this method.
- any(axis=None, where=<no value>)#
Return
Trueif any of the elements along the given axes areTrue.- Parameters:
- Return type:
See also
numpy.any()A functional version of this method.
- astype(dtype, order='K', casting='unsafe', subok=True, copy=True)#
Copy of the array cast to a specific data type.
Equivalent to
numpy.ndarray.astype().
- broadcast_to(shape, append=False)#
A new view of this array with the specified shape.
- Parameters:
- Return type:
See also
named_arrays.broadcast_to()A functional version of this method.
- cell_centers(axis=None, random=False)#
Convert an array from cell vertices to cell centers.
- Parameters:
- Return type:
- combine_axes(axes=None, axis_new=None)#
Combine some of the axes of the array into a single new axis.
- index(value, axis=None)#
- index_secant(value, axis=None)#
- interp_linear(item)#
Linearly interpolate this array to find its value at the given fractional index.
- Parameters:
item (dict[str, AbstractArray]) – A fractional index at which to evaluate the array.
- Return type:
- max(axis=None, initial=<no value>, where=<no value>)#
The maximum value of this array along the given axes.
- Parameters:
- Return type:
See also
numpy.max()A functional version of this method.
- mean(axis=None, where=<no value>)#
The mean value of this array along the given axes.
- Parameters:
- Return type:
See also
numpy.mean()A functional version of this method.
- median(axis=None)#
The median value of this array along the given axes.
- Parameters:
axis (None | str | Sequence[str]) – The logical axis or axes along which the operation is computed.
See also
numpy.median()A functional version of this method.
- min(axis=None, initial=<no value>, where=<no value>)#
The minimum value of this array along the given axes.
- Parameters:
- Return type:
See also
numpy.min()A functional version of this method.
- ndindex(axis_ignored=None)#
An iterator that yields the index of each element of this array.
- Parameters:
- Return type:
See also
named_arrays.ndindex()A functional version of this method.
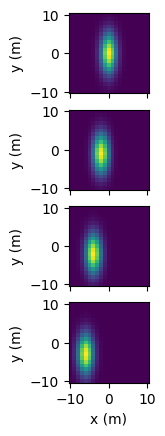
- pcolormesh(axs, input_component_x, input_component_y, input_component_row=None, input_component_column=None, index=None, output_component_color=None, **kwargs)#
Plot a
FunctionArrayviamatplotlib.pyplot.pcolormesh().FunctionArray.pcolormesh()takes in an axes object, or array of axes objects, along with components to be plotted along the x and y plot axes (input_component_xandinput_component_y). Additional components can be tiled along subplot row/column and are specified ininput_component_rowandinput_component_column.import named_arrays as na import numpy as np import astropy.units as u import matplotlib.pyplot as plt position = na.Cartesian2dVectorLinearSpace( start=-10, stop=10, axis=na.Cartesian2dVectorArray( x='position_x', y='position_y', ), num=21, ) * u.m x_width = 5 * u.m y_width = 2 * u.m velocity = 1 * u.m/u.s time = na.ScalarLinearSpace( start=0 * u.s, stop=3 * u.s, num=4, axis='time' ) intensity = np.exp(-(((position.x + velocity*time)/x_width) ** 2 + ((position.y + 2*velocity*time)/y_width)** 2)) scene = na.FunctionArray( inputs=position, outputs=intensity, ) fig, axs = plt.subplots( nrows=scene.outputs.shape['time'], squeeze=False, sharex=True, subplot_kw=dict(aspect='equal'), ) scene.pcolormesh( axs=axs, input_component_x='x', input_component_y='y', input_component_row='time', )
- percentile(q, axis=None, out=None, overwrite_input=False, method='linear', keepdims=False)#
The requested percentile of this array along the given axes.
- Parameters:
q (int | float | Quantity | Self) – The percentile to compute.
axis (None | str | Sequence[str]) – The logical axis or axes along which the operation is computed.
out (None | Self) – An optional output array in which to place the result.
overwrite_input (bool) – Whether to overwrite the input array.
method (str) – How to interpolate the result.
keepdims (bool) – A boolean flag indicating whether to keep the reduced dimensions.
self (Self)
See also
numpy.percentile()A functional version of this method.
- ptp(axis=None)#
The peak-to-peak value of this array along the given axes.
- Parameters:
- Return type:
See also
numpy.ptp()A functional version of this method.
- regrid(inputs, axis=None, method='multilinear', weights=None)#
Resample this function array onto a new set of input coordinates using
named_arrays.regridding.regrid().- Parameters:
inputs (AbstractArray) – The new input coordinates on which to resample the outputs.
axis (None | str | tuple[str]) – The logical axes of the input over which to resample.
method (Literal['multilinear', 'conservative']) – The resampling method to use.
weights (None | tuple[AbstractScalar, dict[str, int], dict[str, int]]) – Optional weights which can be computed in advance using
weights()to greatly speed repeated resampling of the same inputs.
- Return type:
See also
weights()If you need to resample the same coordinates more than once.
- replace(**changes)#
A method version of
dataclasses.replace()for named arrays.- Parameters:
changes – The fields of the dataclass to be overwritten
- Return type:
- reshape(shape)#
Reorganize this array into a new shape.
- rms(axis=None, where=<no value>)#
The root-mean-square of this array along the given axes.
- std(axis=None, where=<no value>)#
The standard deviation of this array along the given axes.
- Parameters:
- Return type:
See also
numpy.std()A functional version of this method.
- sum(axis=None, where=<no value>)#
The sum of each element of this array along the given axes.
- Parameters:
- Return type:
See also
numpy.sum()A functional version of this method.
- to(unit, equivalencies=[], copy=True)#
Convert this array to a new unit.
Equivalent to
astropy.units.Quantity.to().
- to_string(prefix=None, multiline=None)#
Convert this array instance to a string representation.
- to_string_array(format_value='%.2f', format_unit='latex_inline', pad_unit='$\\,$')#
Convert to an array of strings where each string has an appropriately-formatted unit attached to the value.
- to_value(unit, equivalencies=[])#
The numerical value of this array, possibly in a different unit.
Equivalent to
astropy.units.Quantity.to_value().
- transpose(axes=None)#
Reorder the axes of this array to the given sequence.
- Parameters:
- Return type:
See also
numpy.transpose()The
numpyversion of this method.
- var(axis=None, where=<no value>)#
The variance of this array along the given axes.
- Parameters:
- Return type:
See also
numpy.var()A functional version of this method.
- vmr(axis=None, where=<no value>)#
The variance-to-mean ratio of this array along the given axes.
- volume_cell(axis)#
Computes the n-dimensional volume of each cell formed by interpreting this array as a logically-rectangular grid of vertices.
Note that this method is usually only used for sorted arrays.
If self is a scalar, this method computes the length of each edge, and is equivalent to
numpy.diff(). If self is a 2d vector, this method computes the area of each quadrilateral, and if self is a 3d vector, this method computes the volume of each cuboid.
- weights(inputs, axis=None, method='multilinear')#
Compute the resampling weights of this array using
named_arrays.regridding.weights(). The output of this method is designed to be used byregrid().- Parameters:
inputs (AbstractArray) – The new input coordinates on which to resample the outputs.
axis (None | str | tuple[str]) – The logical axes of the input over which to resample.
method (Literal['multilinear', 'conservative']) – The resampling method to use.
- Return type:
See also
regrid()A method designed to use these weights.
- property axes: tuple[str, ...]#
A
tupleofstrrepresenting the names of each dimension of this array.Must have the same length as the number of dimensions of this array.
- property axes_center: tuple(str)#
Return keys corresponding to all input axes representing bin centers
- property axes_flattened: str#
Combine
axesinto a singlestr.This is useful for functions like
numpy.flatten()which returns an array with only one dimension.
- property axes_vertex: tuple(str)#
Return keys corresponding to all input axes representing bin vertices
- axis_detector_x: str = 'detector_x'#
The logical axis corresponding to changes in detector \(x\)-coordinate.
- axis_detector_y: str = 'detector_y'#
The logical axis corresponding to changes in detector \(y\)-coordinate.
- property broadcasted: FunctionArray#
if this array has multiple components, broadcast them against each other.
Equivalent to
a.broadcast_to(a.shape).
- property explicit: FunctionArray#
Converts this array to an instance of
named_arrays.AbstractExplicitArray.
- property indices: dict[str, ScalarArrayRange]#
Compute the index of each element of this array.
See also
named_arrays.indices()A functional version of this method.
- inputs: InputsT = 0#
The inputs of the function.
- property length: FunctionArray#
L2-norm of this array.
- property ndim: int#
Number of dimensions of the array. Equivalent to
numpy.ndarray.ndim.
- outputs: OutputsT = 0#
The outputs of the function.
- property shape: dict[str, int]#
The number of elements along each axis of the array. Analogous to
numpy.ndarray.shapebut represented as adictwhere the keys are the axis names and the values are the axis sizes.
- property size: int#
Total number of elements in the array. Equivalent to
numpy.ndarray.size
- property type_abstract: Type[AbstractFunctionArray]#
The
named_arrays.AbstractArraytype corresponding to this array.
- property type_explicit: Type[FunctionArray]#
The
named_arrays.AbstractExplicitArraytype corresponding to this array.
- property value: FunctionArray#
Returns a new array with its units removed, if they exist.